<!DOCTYPE html>
<html lang="ja">
<head>
<meta charset="utf-8">
<title>2025年7月の気象</title>
<link href="c3.min.css" rel="stylesheet">
</head>
<body>
<div id="my-container" style="width: 640px; height: 480px; ">
<div id="my-chart"></div>
</div>
<script src="d3.min.js"></script>
<script src="c3.min.js"></script>
<script>
let chart = c3.generate({
bindto: '#my-chart',
size: { width: 640, height: 480 }, // グラフ描画領域のサイズ
data: {
x: 'x',
columns: [
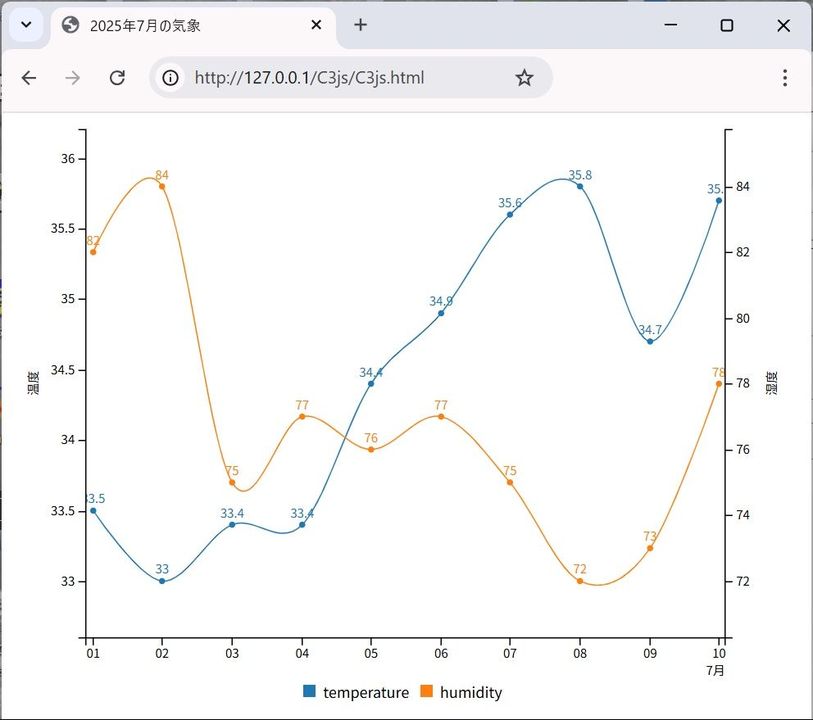
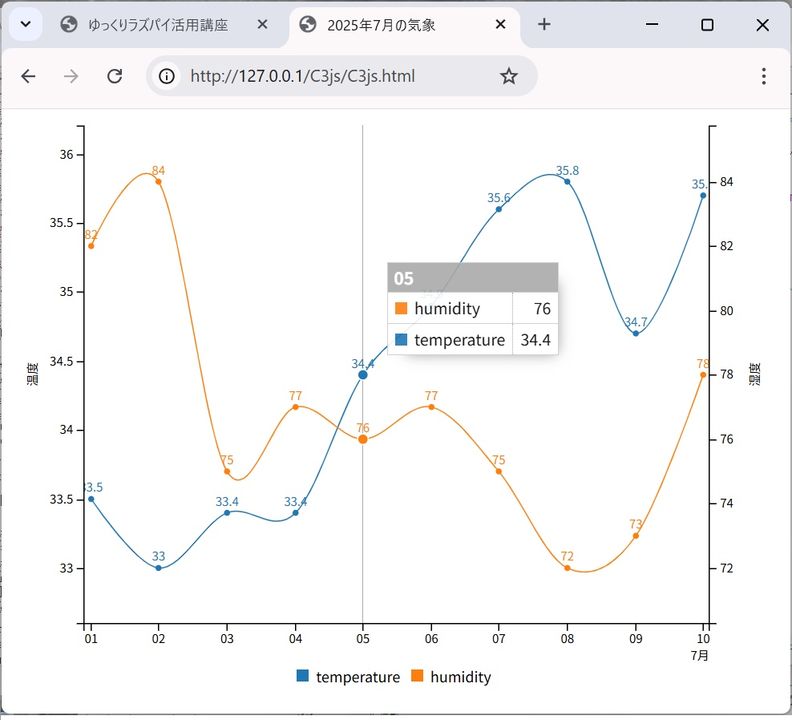
['x', '2025-07-01', '2025-07-02', '2025-07-03', '2025-07-04', '2025-07-05', '2025-07-06', '2025-07-07', '2025-07-08', '2025-07-09', '2025-07-10'],
['temperature', 33.5, 33.0, 33.4, 33.4, 34.4, 34.9, 35.6, 35.8, 34.7,35.7],
['humidity', 82, 84, 75, 77, 76, 77, 75, 72, 73, 78]
],
axes: {
temperature: 'y',
humidity: 'y2'
},
labels: true, // それぞれの点に数値を表示
type: 'spline'
},
axis: {
x: {
label: {
text: '7月',
position: 'outer-middle'
},
type: 'timeseries',
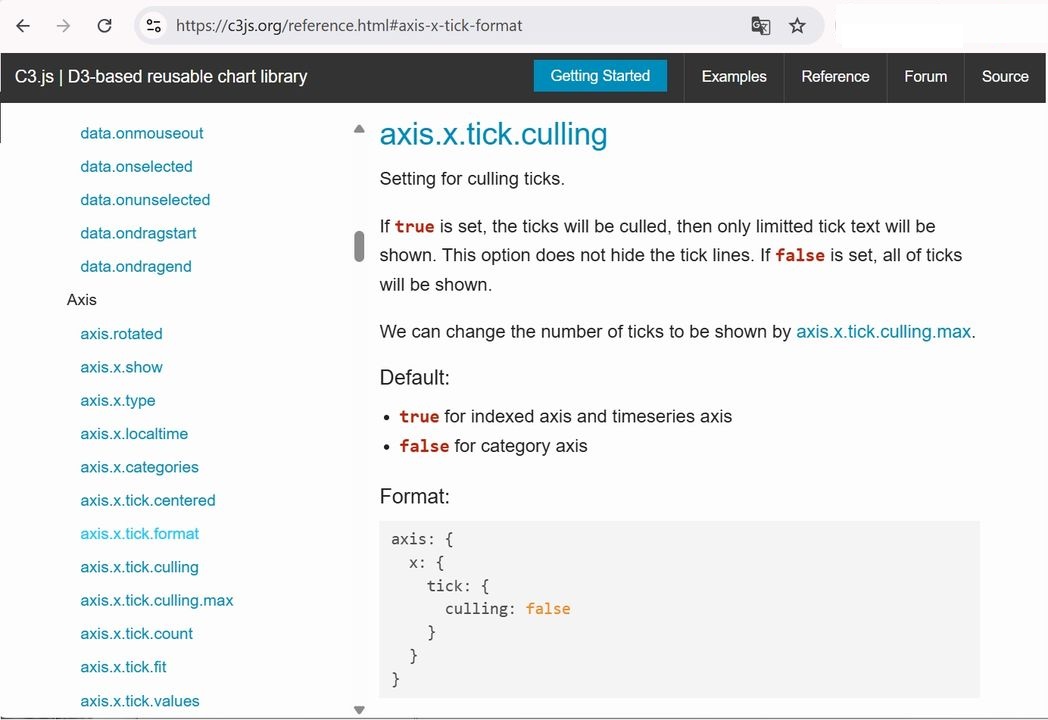
tick: {
format: '%d',
culling: false // 目盛りをすべて表示
}
},
y: {
label: {
text: '温度',
position: 'outer-middle'
}
},
y2: {
label: {
text: '湿度',
position: 'outer-middle'
},
show: true
}
}
});
</script>
</body>
</html>
自分の作成したいグラフのひな形を探して、それを編集するとよいと思います